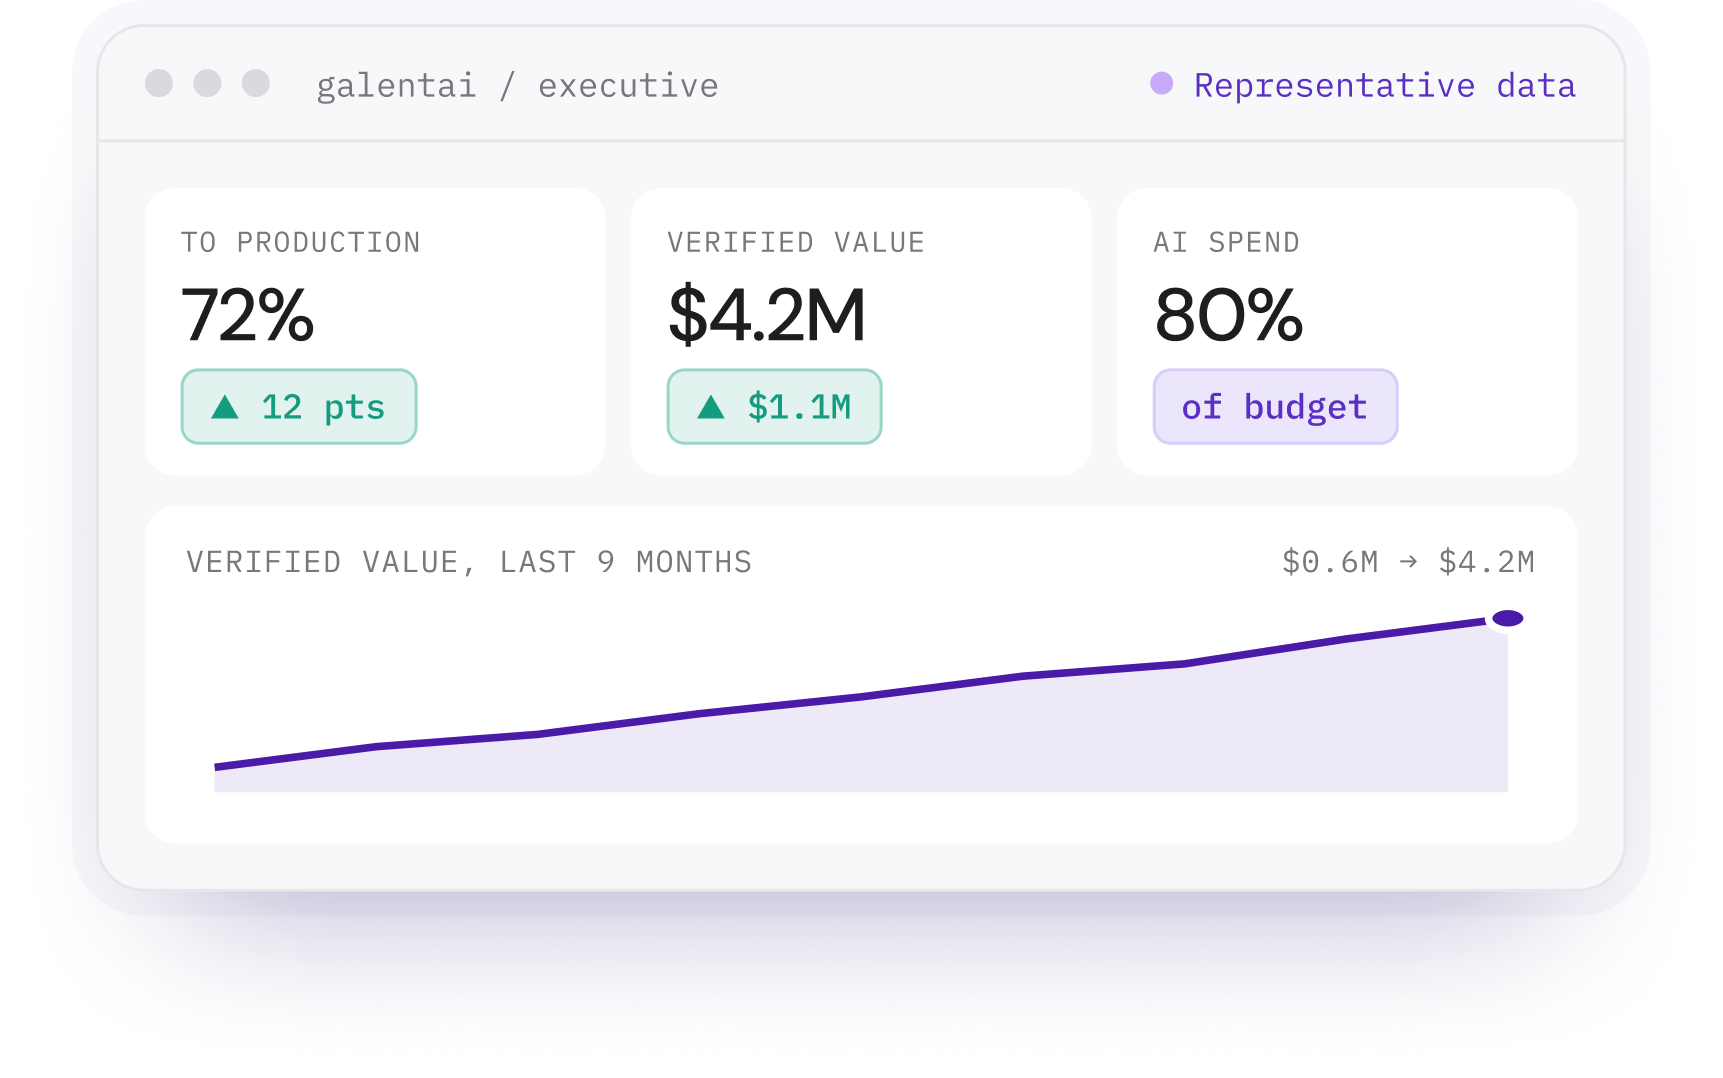
EXECUTIVE DASHBOARD

Your whole AI program. Live. On one screen.

Delivery, spend, risk and impact, read from the same graph your agents work from.
This page uses representative data. Want to see it with your own numbers?
Request A WALKTHROUGH
Board pack

Five numbers your board will ask for

Boards ask the same five questions about AI. The dashboard answers them from live data and exports them straight into your quarterly deck.
Illustrative data · real benchmarks
POC → PRODUCTION
72%
Are pilots reaching production?
▲ 12 pts QoQ
Galent
72%
Industry
48%
Industry: Gartner, 2024
Time to value
6 wks
How fast do we see results?
4 wks early
Galent
6 wks
Industry
10 wks
Median, access to first production outcome
Verified value
$4.2M
What has it returned?
▲ $1.1M QoQ
Q1
$1.1M
Industry: Gartner, 2024
Return per $1
$4.80
Is it worth it?
1.3× average
Galent
$4.80
Industry
$3.70
Leaders
$10.30
Industry: IDC, 2024
Change failure rate
4.1%
Faster without breaking more?
DORA elite
Now
4.1%
Before
9.8%
Elite
≤5%
Industry: IDC, 2024
background texture
Four seats, one source of truth

Same data. Your view.

CIO VIEW

Is the program shipping faster, and safer?

Epics shipped per sprint
2.4× baseline
Estate in the context graph
92%
Repos, schemas and APIs read and linked
▲ 18 pts
Change failure rate
4.1%
Below the 5% DORA elite line
▼ 5.7 pts
Incident tickets
−7.5%
Root causes traced by the RCM Engine
▲ 12 pts QoQ
CIO VIEW

What is AI costing us, and what does it return?

Illustrative data
Cost per claim
−45%
Repos, schemas and APIs read and linked
vs manual
Calls on lower-cost models
41%
Below the 5% DORA elite line
▲ 9 pts
Tokens saved by the graph
38%
Agents fetch only the context they need
per call
CIO VIEW

Can we prove what every agent did, and why?

Illustrative data
AI actions traced
100%
What, why, who, when, which rule
Blocked by policy
312
Stopped before reaching a system of record
this month
Audit export
< 2 min
Any agent, any period
was 3 weeks
CIO VIEW

Where are agents doing real work?

Illustrative data
Handling time per case
4 min
Claims, invoices, KYC, support
was 38 min
Invoices auto-cleared
68%
Best-in-class: 49% to 80%
▲ 21 pts
Human override rate
6%
Reviewers change 6 in 100 decisions
stable
background texture
agent governance
Illustrative data

Every initiative. 

One line each.

INITIATIVE
Legacy core modernization
CTO
Claims processing agents
COO
Developer productivity suite
VP ENGINEERING
Regulatory compliance agent
CHIEF RISK OFFICER
STAGE
PRODUCTION
PRODUCTION
PRODUCTION
Pilot
value
$1.4M cost avoided
$1.3M labor efficiency
$1.5M velocity gain
$340K projected
timeline
Week 6 of 12
Week 8 of 16
Week 11 of 12
Week 3 of 8
health
On Track
On Track
On Track
Watch
New capabilities
Illustrative data

What changes when context is shared.

Legacy estate mapped
BEFORE
6 months
AFTER
3 weeks
Claims checked
BEFORE
12% sample
AFTER
100%
New engineer ramp-up
BEFORE
3 weeks
AFTER
4 days

See your program on this screen.

We connect one system and fill this dashboard with your numbers, in your cloud.
All Galent figures are illustrative and show how the dashboard presents data. Your dashboard is populated from your own systems.
Benchmarks: Gartner AI survey, May 2024 (48% of AI projects reach production) · IDC, 2024 Business Opportunity of AI, sponsored by Microsoft ($3.70 average and $10.30 leader return per $1) · Google Cloud DORA, Accelerate State of DevOps 2024 (elite change failure rate 5%) · Ardent Partners and APQC accounts payable benchmarks (best-in-class touchless processing 49% to 80%).